⛽ Historical Oil Prices (1968–2022): How Geopolitics Reshaped Global Energy Markets
Oil prices reflect the heartbeat of global geopolitics. From Middle Eastern conflicts to economic crises, each spike or crash tells the story of a world in transition. Below is one of the most complete visual timelines of oil price volatility over the past 50 years.
🔥 Why Oil Prices Move So Much: The Fundamentals
Oil is uniquely exposed to geopolitical and economic shocks because both supply and demand react very slowly to price changes:
- Supply rigidity: drilling new wells and expanding capacity takes years.
- Demand rigidity: consumers and industries cannot quickly switch away from oil.
- Result: it takes a big price jump to significantly change global oil consumption.
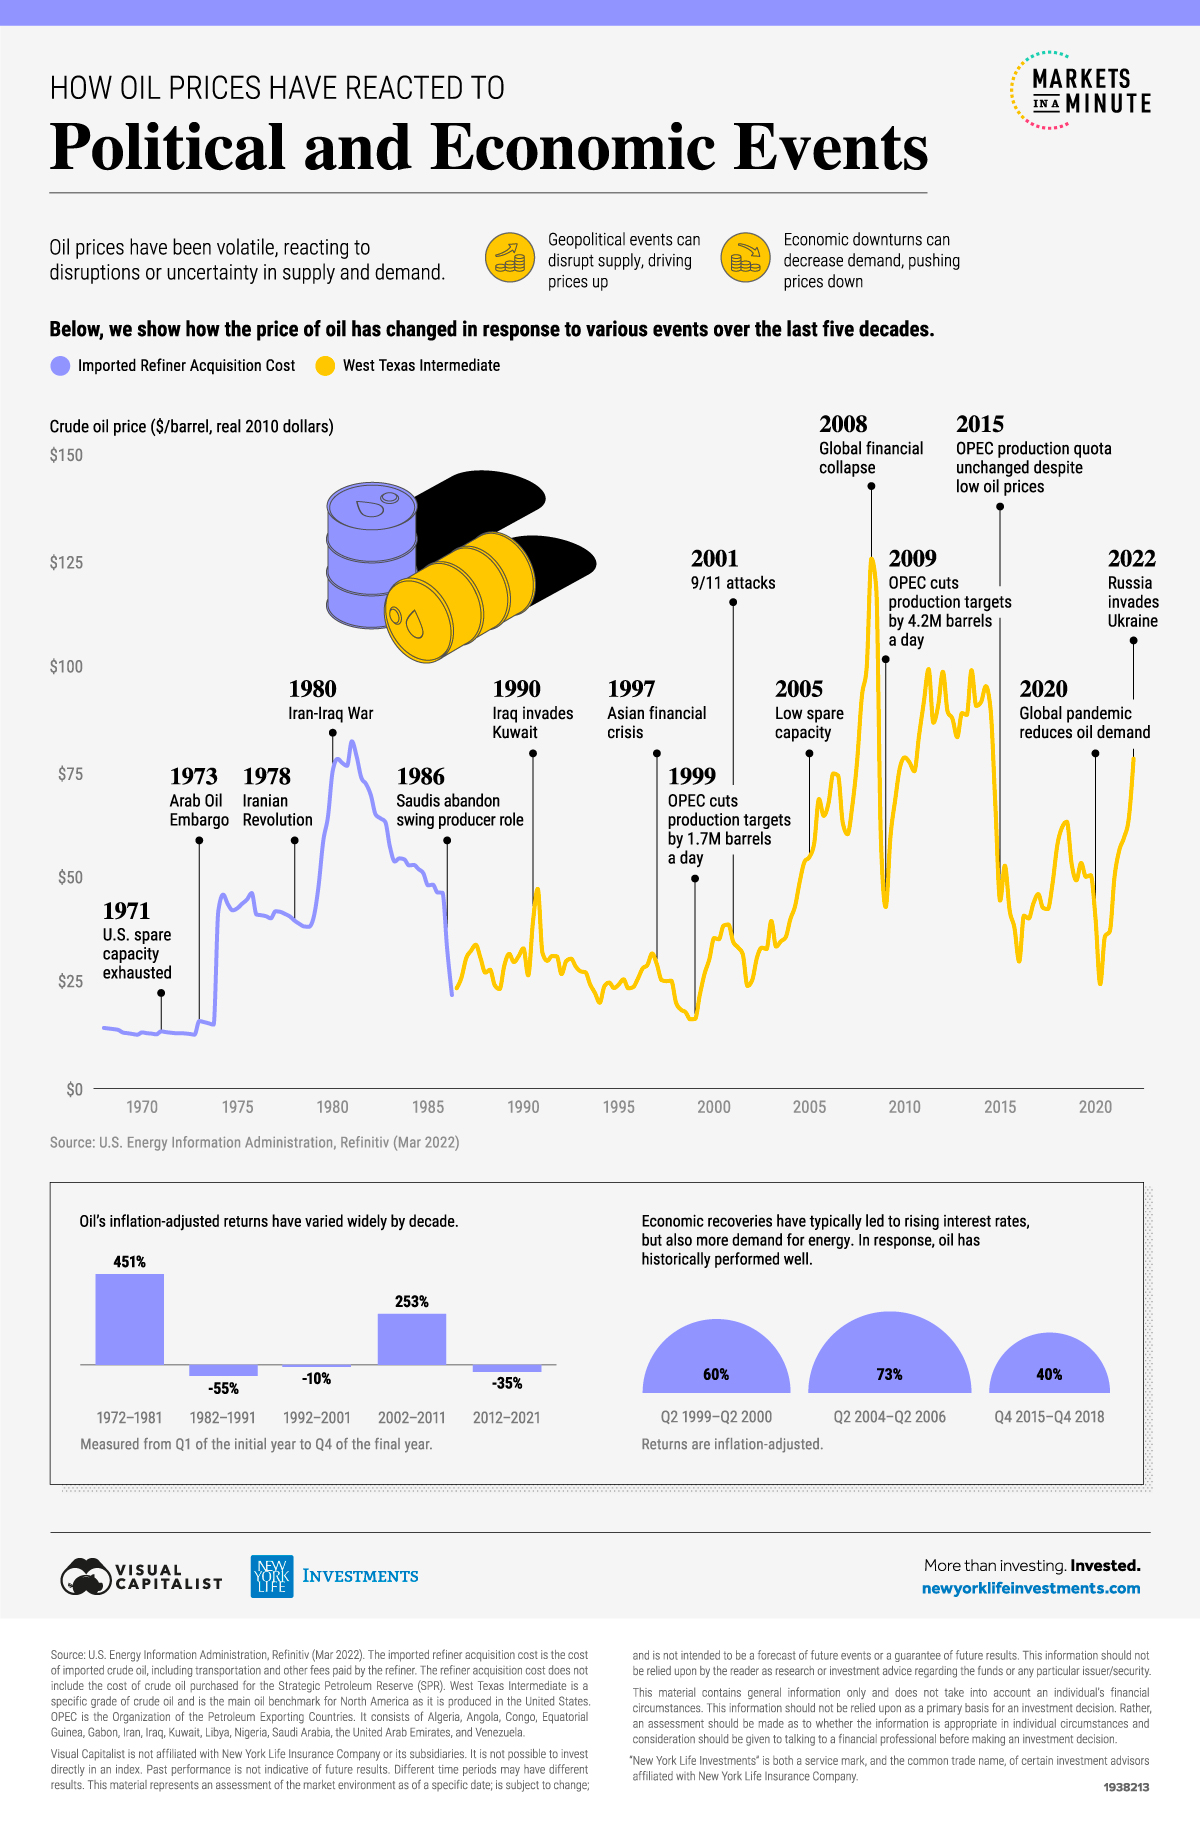
📌 Major Political & Economic Events That Shaped Oil Prices
Below is a narrative of the most important geopolitical disruptions over 50 years, each leaving a distinct imprint on the global oil price curve.
1️⃣ The 1973 Arab Oil Embargo — The First Global Oil Shock
OPEC banned exports to the United States in retaliation for US support to Israel during the Yom Kippur War. The impact was explosive:
- Oil price surged 164% in less than a year.
- Global recession and stock market crash.
- Birth of modern energy security strategies (IEA creation in 1974).
2️⃣ The Iranian Revolution (1978) → Iran–Iraq War (1980)
Political chaos in Tehran followed by a full regional war restricted exports from two major producers:
- Oil reached $76.93 (2010 dollars).
- Start of the “oil weapon” era in Middle Eastern geopolitics.
3️⃣ 1986 Saudi Policy Shift — Price Collapse
Saudi Arabia abandoned its role as the swing producer and opened the taps. Prices fell sharply to restore OPEC’s market share.
4️⃣ The 1990 Gulf War — Iraq Invades Kuwait
Saddam Hussein’s invasion shocked markets:
- Prices jumped from $26 to $47 per barrel in a few weeks.
- US-led coalition restored stability by 1991.
5️⃣ Early 2000s: China’s rise + limited spare capacity
Between 2004 and 2008:
- Global demand surged, led by China’s industrial boom.
- Spare production capacity reached historic lows.
- Prices hit $125/barrel — near record highs.
6️⃣ 2008 Global Financial Crisis — The Crash
Oil collapsed by 66% as global demand evaporated almost instantly.
7️⃣ 2020 Pandemic — Historic Drop
COVID-19 brought the sharpest decline in mobility in modern history:
- Global prices fell nearly 40% in 3 months.
- US crude even traded negative in April 2020 (WTI –$37).
8️⃣ 2022 Russia–Ukraine War — Supply Shock
Russia, one of the world’s top 3 producers, faced global sanctions:
- Oil prices jumped to a 7-year high.
- Europe scrambled for alternative suppliers (US, Qatar, Nigeria).
- Global supply chains reshuffled around new sanctions regimes.
📊 Key Historical Price Points (Inflation-Adjusted)
Reference values in 2010 dollars, covering the most influential events:
| Date | Event | Price (USD) |
|---|---|---|
| Q1 1971 | U.S. spare capacity exhausted | $13.47 |
| Q1 1973 | Arab Oil Embargo begins | $15.90 |
| Q1 1974 | Embargo lifted | $42.00 |
| Q1 1978 | Iranian Revolution | $39.65 |
| Q3 1980 | Start of Iran-Iraq War | $76.93 |
| Q1 1986 | Saudi policy shift | $32.90 |
| Q3 1990 | Iraq invades Kuwait | $39.37 |
| Q4 1990 | Peak during invasion | $47.15 |
| Q1 1999 | OPEC cuts production | $16.41 |
💼 Oil as an Investment: Risk, Opportunity, and Strategy
Oil is one of the world’s most volatile asset classes. But volatility also brings opportunity.
⚠️ Risks
- Extreme price swings tied to geopolitics.
- Long-term pressure from decarbonization policies.
- Environmental, social, and governance (ESG) constraints.
📈 Opportunities
- Diversification: low correlation with bonds and equities.
- Inflation hedge: energy tends to outperform when rates rise.
- Economic-cycle exposure: strong during recoveries.
Understanding historical price cycles is essential for investors, policymakers, and energy strategists navigating the future of global markets.

About the Author
With extensive experience in international finance, the author structures high-level funding
solutions for governments, private corporations, public–private partnerships (PPP),
and large-scale development projects across energy, infrastructure, real estate,
education, healthcare, agriculture, and humanitarian sectors.
Operating through a global network of top-tier banks, institutional partners,
private capital groups, and regulated financial platforms, the author manages
confidential and compliant strategies involving SBLC, BG, MTN, DLC,
trade finance, structured finance, and monetization frameworks.
All processes follow strict AML/KYC, due diligence, and international regulatory
standards.
The author’s mission is to simplify access to world-class financial knowledge and
bring clarity to complex funding mechanisms, empowering governments, communities,
and project owners to realize transformative initiatives that enhance education,
healthcare, housing, clean energy, and economic development in emerging regions.
Professional Engagement & Confidentiality
All interactions are confidential, conducted with integrity, and aligned with
international compliance protocols.
No public fundraising, investments, or financial solicitations are offered.
Each project is treated with discretion, professionalism, and strategic precision.
Important Legal Disclaimer
This content is strictly educational and informational.
It does not constitute financial advice, investment solicitation, securities
promotion, or an offer to participate in any financial product, instrument, or program.
Any mention of SBLC, BG, MTN, PPP, monetization, structured finance, or trade finance
is purely illustrative and intended to promote understanding of global financing
mechanisms.
All real transactions require independent legal, tax, and regulatory assessments
by qualified professionals.
The objective of these publications is to contribute to global development by
promoting transparency, education, access to funding knowledge, and sustainable
solutions for social welfare, healthcare, housing, and humanitarian progress.
Contact
For confidential professional inquiries:
Email: info@nnrvtradepartners.com